France’s population, by contrast, was more evenly distributed across the age ranges, with similar figures (around 7% to 8% of all people) for each five-year cohort between the ages of 0 and 40

很多同学可能对雅思小作文不太重视,甚至是对小作文根本不加练习,只关注大作文。平时应该多看看雅思小作文,那你知道雅思小作文范文有哪些吗?下面是小编收集整理的一些雅思小作文范文30篇,大家一起来看看吧!
雅思小作文范文30篇第1篇
The chart below shows the total number of Olympic medals won by twelve different countries.
The bar chart compares twelve countries in terms of the overall number of medals that they have won at the Olympic Games.
It is clear that the USA is by far the most successful Olympic medal winning nation. It is also noticeable that the figures for gold, silver and bronze medals won by any particular country tend to be fairly similar.
The USA has won a total of around 2,300 Olympic medals, including approximately 900 gold medals, 750 silver and 650 bronze. In second place on the all-time medals chart is the Soviet Union, with just over 1,000 medals. Again, the number of gold medals won by this country is slightly higher than the number of silver or bronze medals.
Only four other countries - the UK, France, Germany and Italy - have won more than 500 Olympic medals, all with similar proportions of each medal colour. Apart from the USA and the Soviet Union, China is the only other country with a noticeably higher proportion of gold medals (about 200) compared to silver and bronze (about 100 each).
雅思小作文范文30篇第2篇
The bar graph shows the global sales (in billions of dollars) of different types of digital games between 2000 and 2006.
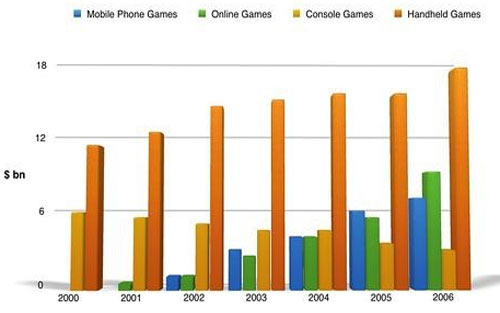
The bar chart compares the turnover in dollars from sales of video games for four different platforms, namely mobile phones, online, consoles and handheld devices, from 2000 to 2006.
It is clear that sales of games for three out of the four platforms rose each year, leading to a significant rise in total global turnover over the 7-year period. Sales figures for handheld games were at least twice as high as those for any other platform in almost every year.
In 2000, worldwide sales of handheld games stood at around $11 billion, while console games earned just under $6 billion. No figures are given for mobile or online games in that year. Over the next 3 years, sales of handheld video games rose by about $4 billion, but the figure for consoles decreased by $2 billion. Mobile phone and online games started to become popular, with sales reaching around $3 billion in 2003.
In 2006, sales of handheld, online and mobile games reached peaks of 17, 9 and 7 billion dollars respectively. By contrast, turnover from console games dropped to its lowest point, at around $2.5 billion.
雅思小作文范文30篇第3篇
The diagram below shows how solar panels can be used to provide electricity for domestic use.
The picture illustrates the process of producing electricity in a home using solar panels.
It is clear that there are five distinct stages in this process, beginning with the capture of energy from sunlight. The final two steps show how domestic electricity is connected to the external power supply.
At the first stage in the process, solar panels on the roof of a normal house take energy from the sun and convert it into DC current. Next, this current is passed to an inverter, which changes it to AC current and regulates the supply of electricity. At stage three, electricity is supplied to the home from an electrical panel.
At the fourth step shown on the diagram, a utility meter in the home is responsible for sending any extra electric power outside the house into the grid. Finally, if the solar panels do not provide enough energy for the household, electricity will flow from the utility grid into the home through the meter.
雅思小作文范文30篇第4篇
The charts below compare the age structure of the populations of France and India in 1984.
The two charts compare the populations of France and India in terms of age distribution by gender in the year 1984.
It is clear that the population of India was younger than that of France in 1984, with a noticeably larger proportion of people aged under 20. France, on the other hand, had a significantly larger percentage of elderly inhabitants.
In India, close to 14% of people were aged 5 or under, and each five-year age bracket above this contained an increasingly smaller proportion of the population. France’s population, by contrast, was more evenly distributed across the age ranges, with similar figures (around 7% to 8% of all people) for each five-year cohort between the ages of 0 and 40. Somewhere between 10% and 15% of all French people were aged 70 or older, but the equivalent figure for India was only 2%.
Looking more closely at gender, there was a noticeably higher proportion of French women than men in every cohort from age 50 upwards. For example, almost 3% of French 70- to 75-year-olds were women, while just under 2% were men. No significant gender differences can be seen on the Indian population chart.